What can older people like myself do to improve their health and increase their chances of living longer? I am exploring these and looking to improve my own situation and outlook. So, in my initial post I talked about my body mass index (at 28.6 I’m overweight), my blood pressure was high, and I had metabolic syndrome. The key word there being had.
Last summer, I determined to bring about changes in my life and dietary habits. I did only one thing consistently. I gave up consuming sugar. I did not drink soda often anyway, but I gave it up entirely and gave up my favorite sweet iced tea. And I gave up sweets of any kind, donuts, and most processed foods. My inspiration for all of that was Dr. Robert Lustig’s famous video, Sugar, The Bitter Truth.
Sugar makes you fat!
The link between sugar and obesity is evident looking at statistics from the late 20th century. The percentage of the population that was obese essentially doubled in all categories since 1980. For example for people aged 45 to 64, the percentage of the population that is obese increased from 20% to about 40%. As sugar consumption rose, so did obesity.
However, starting in 1999, the per capita sugar consumption in the US started to go down, while obesity rates continued to climb. A respected neuroscientist, Dr. Stephan J. Guyenet, used this data to suggest that sugar consumption is not a unique cause of obesity. He produced the following graph as evidence:
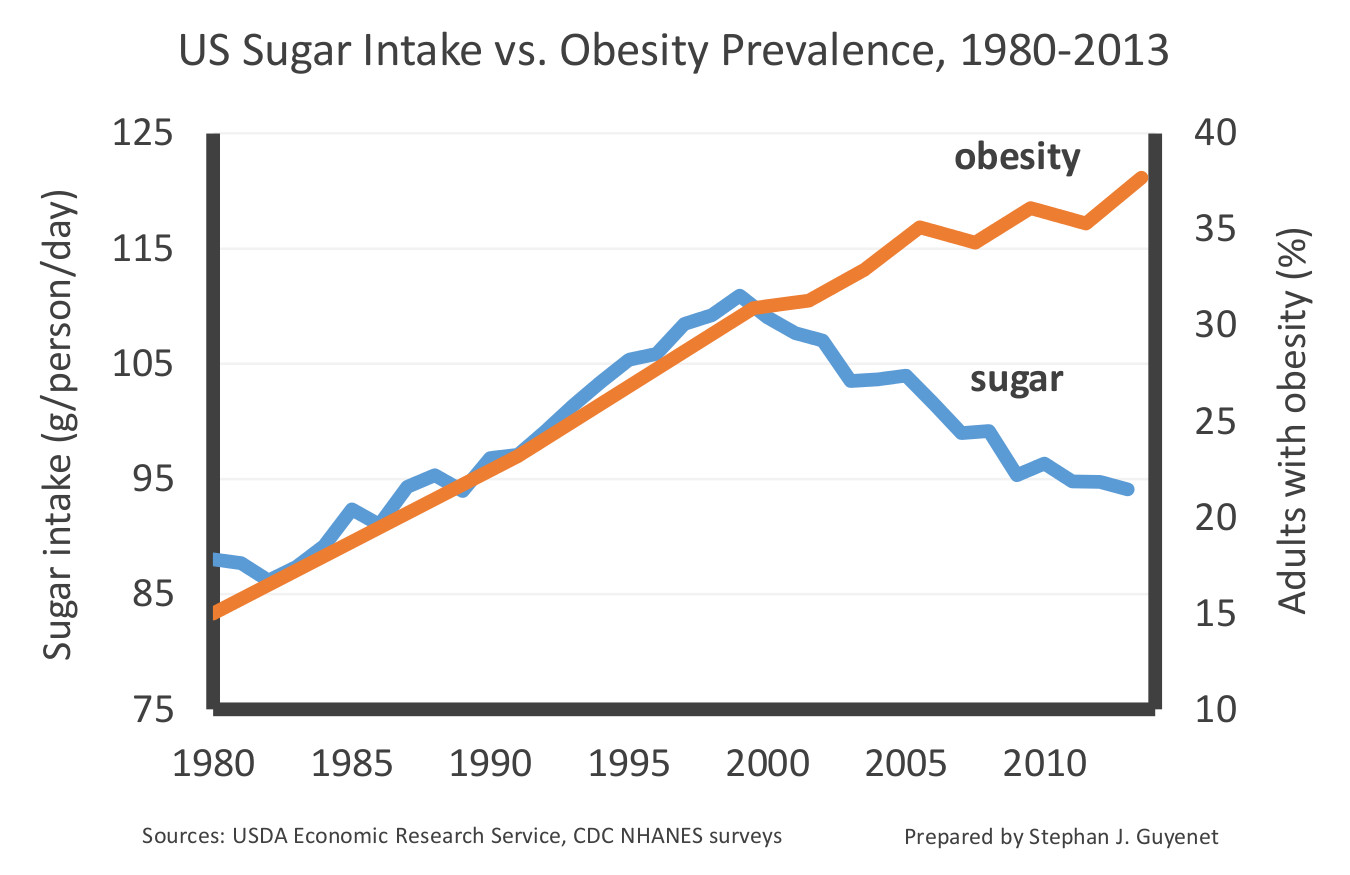
This looks pretty convincing does it not?
Well, it shouldn’t. Gary Taubes (author of The Case Against Sugar), criticizes this evidence and Dr. Guyenet’s conclusions pretty decisively in an article, The Case against Sugar Isn’t So Easily Dismissed. He points out that the sugar consumption levels remain very high and that the per capita decline in the consumption of sugar in the 21st century is very modest. The graph deceptively exaggerates the drop. I redrew the graph as follows:

But the fact remains that sugar consumption is going down. Does this suggest that sugar is not the most significant cause of America’s obesity epidemic? Not really. The assumption behind that conclusion is that these trend lines will always correlate one to one. But they won’t because the obesity percentage represents a cumulative effect of past behaviors, while the per capita sugar intake is not cumulative.
For example, if I ate 110 grams of sugar a day and got fat as a result, but if I then reduce my sugar intake to 93 grams a day, will I then become thin? No. A modest reduction in sugar consumption will not reverse the damage, and if I continue to eat sugar at that lower rate I will continue to get fat, just maybe at a slightly slower rate. Similarly, the number of new cases of obesity will continue to rise because the sugar consumption remains high, but the rate of growth will slow. And that is exactly what we see in this graph. When the decline began, the climb in the percentage of obesity slowed. The graph, in fact, makes the correlation a bit stronger, not weaker.
I personally have no doubt that sugar consumption is a health care disaster. But we should remember that correlation does not always equal causation. For example, fat people wear bigger clothes. That’s a strong correlation, but it does not show that big clothes make people fat. For sugar, however, we now have enough scientific research to show the causal connections. One such paper is Fructose and NAFLD: The Multifaceted Aspects of Fructose Metabolism. This paper shows that excess sugar consumption can lead to liver damage, inflammation and “leaky gut” issues, but insulin resistance leading to type 2 diabetes is the primary risk.
What does insulin do? Insulin is a hormone secreted by your pancreas. Insulin’s job is to tell the body to store energy. It is the energy storage hormone. So, insulin signals your cells to open up and accept both fat (triglycerides) and blood sugar (glucose) to use or store. Additionally, it prevents the cells from using stored glucose and fat for energy.
What causes insulin resistance? Again we have good research indicating that it is “Visceral adiposity” or fat found in the muscles, liver and around the vital organs in your body. It’s fat inside our muscle cells and liver. I give links to research papers below that show this link. The mechanism is no mystery. If your fat cells get filled up with excess energy in the form of fat or glucose, some of which gets converted to fat, then it may simply get too full and resists receiving any more. It ignores the signal that insulin gives. But, sustained high blood sugar levels are dangerous to the body, so the body puts more insulin into the blood causing a condition known as Hyperinsulinemia. The increased signaling does cause the cells to store more fat and glucose, but over time, there is a diminishing return. When the process breaks down over a period of years, you get Type II diabetes.
But how does sugar cause fat in cells?
I’ll try to explain. Sugar or sucrose consists of sucrose molecules. The sucrose molecule is the union of a glucose molecule and a fructose molecule. The glucose molecule is relatively benign. It is simply, the main fuel source for the body. However, when you eat sugar, your blood glucose levels tend to rise rapidly resulting in a rapid rise in blood insulin levels.
Fructose, however, does not enter the bloodstream. Rather it is processed by the liver.** There some of it gets converted into glucose and lactate (simple sugars the body uses as fuel) and the remaining gets converted into triglycerides or fat. If fructose levels are too high, the mechanisms that convert fructose to glucose are overwhelmed and most of the fructose gets converted to fat. This process goes by the name hepatic de novo lipogenesis which are Latin words describing new fat generation by the liver.
This fat is stored in the liver or released into the bloodstream as triglycerides. By the time this happens, a person’s insulin is elevated due to the increased blood glucose from the other half of the sugar molecule. The elevated insulin turns on the bodies energy storage mechanisms telling the body to store fat in the liver and adipose (meaning fat) tissue. The fat that gets stored consists of triglycerides created by the liver from fructose. Eating lots of sugar over time causes the build-up of these Intramyocellular lipids or the fat inside our muscle cells that create insulin resistance.
Fructose makes you overeat!
From the article Sugar consumption, metabolic disease and obesity: “Mechanistically, it is plausible that fructose consumption causes increased energy intake and reduced energy expenditure due to its failure to stimulate leptin production.” Normally, when you eat, your body decreases levels of the hunger hormone, Ghrelin, and increases Leptin, a hormone that inhibits hunger. Fructose by-passes normal digestion by being processed in the liver. As such, it fails to stimulate leptin, so you continue to eat more than you would when eating other foods.
Fructose in large doses can cause other serious issues. A rapid rise in liver fat causes inflammation in the liver or fatty liver disease. Fructose not absorbed by the liver, that passes into the large intestine where the wrong gut bacteria feed on it, causes changes that reduce the gut permeability. There is a mucus that lines the inside of your intestines that protects you from compounds in your food that can cause you harm. When this mucus is reduced, your gut is more permeable and can let in some of these compounds into your bloodstream. This is what is meant by having “leaky gut” or “leaky gut syndrome”.
So, my first step in recovering my health was to eliminate sugar as much as possible. That means no adding sugar to any food I make, avoiding any sweetened beverages, avoiding sweets of any kind such as ice cream, pastries, and cakes, and avoiding almost all processed food, 80% of which has added sugar.
Next: Fasting. How removing sugar and fasting improved my health.
** See an article below. There is evidence that some fructose may be converted to glucose in the small intestine, but the operative word there is small. It is consistent with the idea that we are created to process small amounts of fructose that we get from fruit, but larger amounts are essentially a toxin similar to alcohol.
Here are a few research papers showing the link between fat and insulin resistance (there are many others):
Visceral Adiposity, Insulin Resistance, and Type 2 Diabetes
What causes the insulin resistance underlying obesity?
A figure from that last article:

And here are some research papers showing the link between fructose and the increase in visceral adipose tissue or fat:
Sugar consumption, metabolic disease, and obesity: The state of the controversy.
Metabolic effects of fructose and the worldwide increase in obesity.
Fructose metabolism and metabolic disease.
Here is a more recent research paper that absolves fructose so long as the amount consumed remains small, such as the amount you might get from a piece of fruit: The Small Intestine Converts Dietary Fructose into Glucose and Organic Acids. I think it’s worth quoting:
“Low doses of fructose are ∼90% cleared by the intestine, with only trace fructose but extensive fructose-derived glucose, lactate, and glycerate found in the portal blood. High doses of fructose (≥1 g/kg) overwhelm intestinal fructose absorption and clearance, resulting in fructose reaching both the liver and colonic microbiota. Intestinal fructose clearance is augmented both by prior exposure to fructose and by feeding. We propose that the small intestine shields the liver from otherwise toxic fructose exposure.”
What this tells us is that fructose in the low doses you find in whole foods are harmless, but large does are toxic when reaching the liver and the colonic microbiota.

Images from https://www.ncbi.nlm.nih.gov/books/NBK19623/figure/chartbook.f7 showing the doubling of obesity in the USA since the 1970s.
The latest government averages:

From from Stephan J Guyenet, The science of body weight and health. Based on The latest CDC data on obesity.
