Is High LDL always bad?


In my previous post, I discussed my most recent blood lipid panel and discussed how much improved my triglycerides and HDL are compared to anything I have had in the last 30 years.

For review here were my most recent Lipid Panel numbers:

  • Total Cholesterol     265  mg/dl    or    6.85 mmol/l
  • HDL Cholesterol        62  mg/dl    or    1.60 mmol/l
  • LDL Cholesterol       183 mg/dl     or   4.73 mmol/l
  • Triglycerides              87  mg/dl    or    0.98 mmol/l

Triglycerides are supposed to be below 150.   They are 87.  HDL is supposed to be greater than 40.  It is 62.  More recent standards now focus not only on the absolute cholesterol levels but on the ratio of total cholesterol to HDL.  Here are the guidelines:

Total cholesterol-to-HDL ratio and heart disease risk:

  • 3.4 signifies half the average risk for men (that would be 3.3 for women).
  • 5 signifies average risk for heart disease for men. (4.4 for women).
  • 9.6 signifies about double the average risk for men. (7 for women).

See Making sense of cholesterol tests.

My ratio is 4.3 which indicates a below average risk for heart disease even though I have high total cholesterol and LDL.

Now, as I mentioned in my last post, my test was taken three days into a water only fast and after eating a ketogenic diet for some days prior to the fast.  As explained then this would likely artificially boost my LDL numbers.  So, after over a week of normal eating, I took a home test of my cholesterol levels.   I read 225 for total cholesterol and 65 for HDL, making my LDL out to be 160.  But, I don’t trust my reading of the test so I won’t vouch for the accuracy of that reading.   I do think it confirms that my LDL lowered a good bit from my lab test, but that is all I think I can really say from that home test. But, if accurate, my ratio would be 3.4 signifying half the average risk for heart disease.  I require a new lipid panel to know for sure.

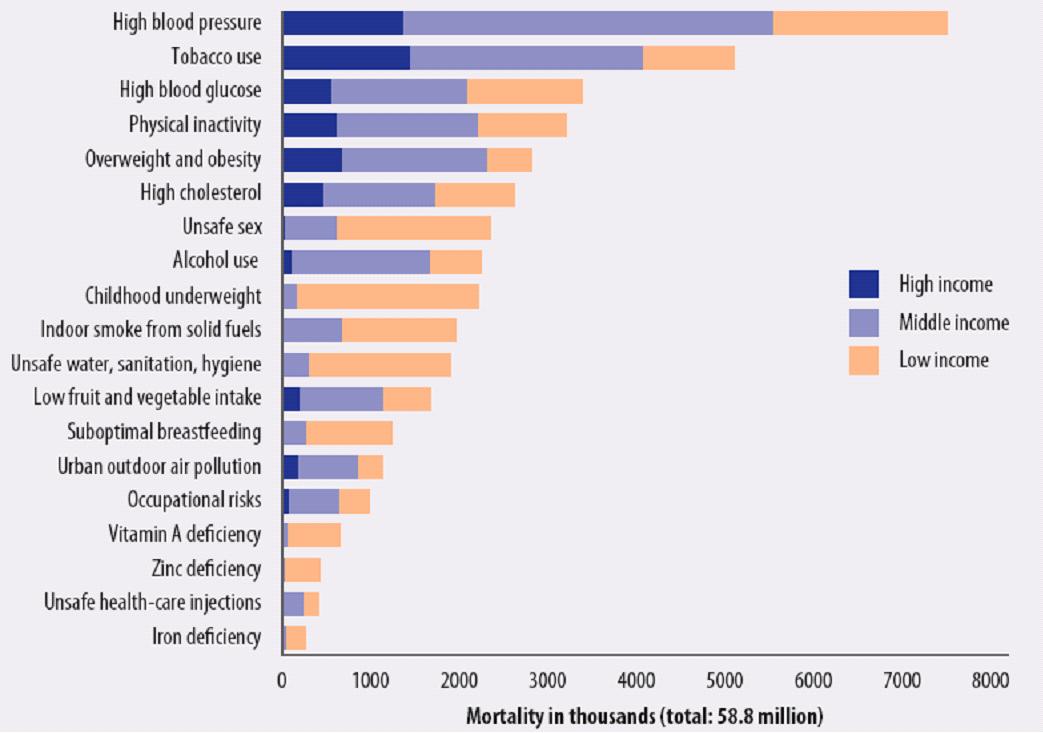
Here are some charts pulled from a talk by Ivor Cummins on the Primary Causes of Early Mortality.

The first one is based on the data I give above using data from the well known Farmington Heart Study:

ldl vs hdl and heart disease risgk

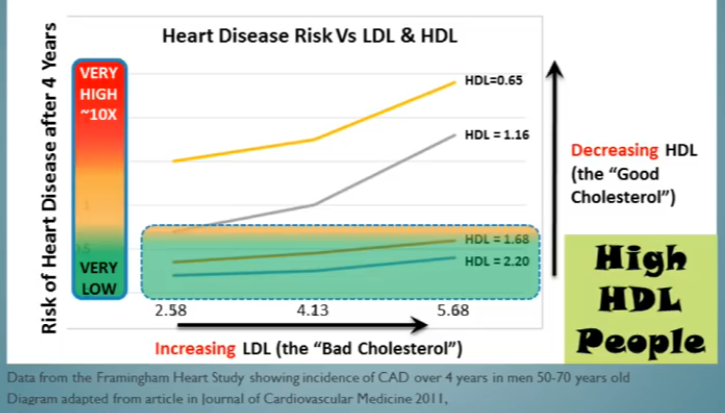
Note the use of European measures in this graph.  In my case with an HDL of 1.60 and LDL of 4.73, I am right at the top of the very low range for any risk of heart disease.

But the cholesterol ratio is not the only factor to consider.  Triglyceride levels are also predictive.  The lower the triglycerides, the better.  Here is another graph from Ivor’s talk:

Triglycerides heart disease risk

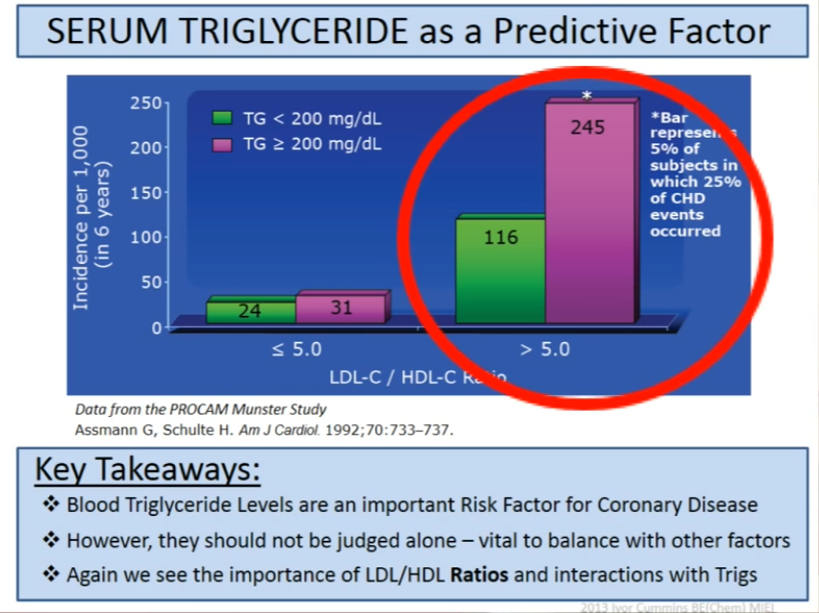
This data is from the The Münster Heart Study (PROCAM)

This graph uses the ratio of LDL to HDL instead of the total cholesterol to HDL.  In my case that would be 2.95.  Individual with a high ratio, but relatively low triglyceride levels below 200 had only half the number of Cardiovascular Heart Disease events as those with high triglycerides.  However, if your ratio is good and your triglycerides are low, then you risk is much smaller.

I did show very high LDL levels in my recent lab test.  From my home test it would seem that they are still high, if not as high as during my fast.  Regardless, it does seem that my heart disease risk is now much lower than it has been in many years due to the much improved HDL and triglyceride levels.

One last graph before I go.  It is well known that not all LDL cholesterol is alike. LDL is used to transport fat around the body, particularly from the liver to cells for use or storage.  LDLs that are “full” are large and buoyant.  These large and fluffy LDL particles cannot penetrate arterial cell walls to form plaques.  As such, they are not “bad” at all.  The truly bad cholesterol are LDLs that have released their stores and turn into small dense LDLs that are the ideal size to penetrate small arterial injuries or cuts and embed themselves causing an immune response and the formation of arterial plaque that calcify and harden your arteries.

There is a relationship between triglyceride levels and LDL particle size.  In general, the lower your triglycerides, the greater the percentage of LDL is of the large buoyant kind.  And that is good.  Given my rather low triglycerides, I have reason to believe that my heart disease risk is even lower than indicated by my cholesterol ratio alone.

triglycerides to ldl

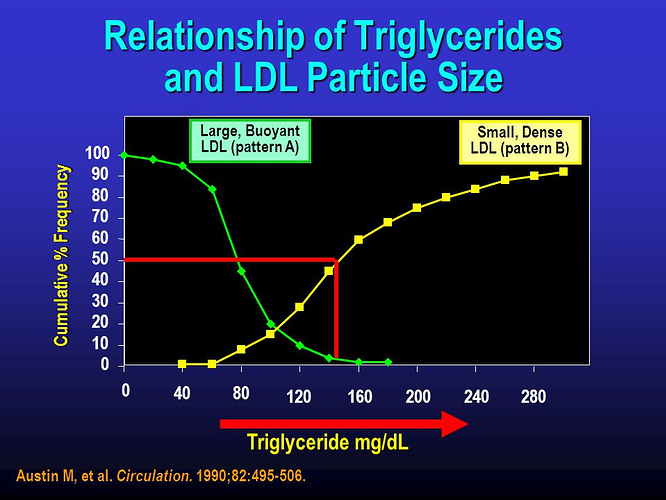
This graph a prettier version of one in the original article (Atherogenic Lipoprotein Phenotype A Proposed Genetic Marker for Coronary Heart Disease Risk).

What is Perennial Longevity?

Perennial longevity is what I am calling getting old people to live longer and healthier lives.  Simple as that.

I plan on examining and reporting on all the ways to improve health and longevity, especially in older people.  And I plan on testing many approaches to improving health on myself.  I have no agenda.  I am not pushing or selling any products, diet programs or supplements.  I am agnostic regarding diets, so I am not an evangelist for Keto diets or vegan diets or XYZ diets.  I am only interested in living longer and healthier so I can accomplish goals I have failed to accomplish thus far, and because I am an older father still having two kids at home and wish to live to see and enjoy grandchildren if God permits.

You see at 65, I am a mess of sorts.  At 5′ 6″ (maybe just a bit more), and now 177 pounds, I have a BMI of 28.6 which makes me significantly overweight.  BMI is your body mass index.  It is calculated by taking your weight in kilograms and dividing it by your height in meters squared.  (Or just google “BMI Calculator” and a nice BMI calculator tool will appear for you.)  By World Health Organization standards, this is overweight.  A BMI of 30 or more is obese.

I’m actually better than I used to be.  At one point I was at least 195 pounds, and more likely 200 or more, I refused to weigh myself for much of that period.  At that level, my BMI was around 32.  (See the BMI chart at the end of this post.)

My blood pressure is high.   My latest measurement was 135/93.  The top measure is the systolic blood pressure or a measure of the pressure exerted when the heart beats.  The bottom value is the diastolic blood pressure or a measure of the pressure exerted between heartbeats.  The units of measure are mm HG for the number of millimeters of mercury displaced by that level of pressure   The systolic pressure of 135 is classified as pre-hypertension, while the diastolic pressure of 93 is classified as hypertension stage 1.

Note that Europeans use a different unit of measure called kilopascals.  You can convert from mmHg to kilopascals by dividing by 7.5.

At least that was the case prior to 2017.  In late 2017, American Heart Association guidelines were changed.  Here are the current standards:

  • Normal blood pressure. Your blood pressure is normal if it’s below 120/80 mm Hg.
  • Elevated blood pressure. Elevated blood pressure is a systolic pressure ranging from 120 to 129 mm Hg and a diastolic pressure below 80 mm Hg. Elevated blood pressure tends to get worse over time unless steps are taken to control blood pressure.
  • Stage 1 hypertension. Stage 1 hypertension is a systolic pressure ranging from 130 to 139 mm Hg or a diastolic pressure ranging from 80 to 89 mm Hg.
  • Stage 2 hypertension. More severe hypertension, stage 2 hypertension is a systolic pressure of 140 mm Hg or higher or a diastolic pressure of 90 mm Hg or higher.

But what does that mean?

First, understand that absent smoking high blood pressure is the number one risk factor for death in most of the world.  (See the chart at the end of this post.) In 2004 for high-income countries such as the United States, it was far higher than factors such as obesity, high cholesterol, or physical inactivity.  It was the highest risk factor by far worldwide, but in the high-income countries, only smoking was higher.  No doubt nothing has changed since then,

My blood pressure is regarded as dangerously high, but up to now doctors in the US do not intervene with prescription drugs until the blood pressure exceeds 140/90.  My doctor has not yet prescribed blood pressure medications because I have stayed below 140 for my systolic for some time.   The reason for not prescribing blood pressure medications is that the risk of side effects are considerable.  I may explore that issue more in a later post.

In addition, my cholesterol is high.  In the past, I also had low HDL cholesterol and high triglycerides.  I’ve had kidney stones.  I have an enlarged prostate (or Benign Prostatic Hyperplasia aka BHP).  In the past, I would definitely have met the criteria for a diagnosis of metabolic syndrome.  (See the NCBI article, A comprehensive definition for metabolic syndrome.)   You have metabolic syndrome if you met three of five criteria.  1) if you are fat, 2)  have high fasting blood sugar (but not yet diabetic), 3) have high triglycerides, 4) have high cholesterol, and 5) have high blood pressure.  A person with metabolic syndrome is regarded at a much greater risk for Cardiovascular Disease (CVD) and Type Two Diabetes (T2B) as well as kidney damage.

Now, I did say “was” for some of these criteria.  That has to do with my first investigation, and that is therapeutic fasting.  That is the subject of an upcoming entry.

Here is a BMI chart by weight and height:

BMI Chart

BMI chart – created by vertex42.com used with permission.

Here’s a chart from The Global Health Risks Report produced by the World Health Organization:

This was from 2004 which is a while ago now, but no doubt High Blood Pressure remains a major risk factor for death.

Here is a handy table describing the criteria for metabolic syndrome from the NCBI article (Table One)I mention above:

Table 1.

Definitions of metabolic syndrome

An external file that holds a picture, illustration, etc. Object name is dmm001180t1.jpg


My friend Doug Gilliland mentioned that instead of BMI, he goes by body fat percentage. He showed me the following chart from https://www.builtlean.com/wp-content/uploads/2010/08/Ideal-Body-Fat-Percentage-Chart3.jpg:


He’s right that this is a better measure.  BMI can be misleading.  For example, if you are a bodybuilder and have a lot of muscle mass, your weight may be high while your percentage of fat is low.  In that case, you will have a large BMI, but you would not be overweight, obese, or unhealthy.

But BMI is simple to calculate and is a good proxy for determining overweight and obese conditions for most people.